Abstract
Background: Malnutrition among children in Ethiopia remains a serious public health concern, with feeding practices frequently falling below international standards. Diets are often cereal-based with low inclusion of animal-source foods, resulting in poor dietary diversity. This study assessed child feeding practices and household dietary diversity in three districts of Oromia. Methods: A community-based cross-sectional survey was conducted among 332 caregivers of children aged 6–59 months. Data were collected using a structured questionnaire and a 24-hour dietary recall. Nutrient intake was analyzed using the Ethiopian Food Composition Tables and SPSS v25. Dietary diversity was evaluated using WHO and FAO criteria, and nutrient adequacy was determined using Nutrient Adequacy Ratio (NAR) and Mean Adequacy Ratio (MAR). Results: Early initiation of breastfeeding was 59%, while exclusive breastfeeding at six months was 63%. Timely introduction of complementary feeding was only 39%, and continued breastfeeding at two years was 64.5%. Just 43% of children consumed at least four food groups, with 37% falling into the low dietary diversity category. The MAR was 82%, with inadequate intakes of calcium, fat, and vitamin C, while protein, carbohydrate, iron, and energy were sufficient. At the household level, 51% consumed from four food groups, but only 10% consumed more than six. Cereals dominated diets (>90%), while meat (12.7%), eggs (5.7%), and fruits (25%) were seldom consumed. Conclusion: Suboptimal infant and young child feeding practices and low dietary diversity persist in the study areas. Strategies are needed to strengthen optimal breastfeeding, promote nutrition education, and diversify diets through improved livestock production, horticulture, and small-scale irrigation.
Keywords
Dietary Diversity, Children Feeding Practice, Nutrient Adequacy Ratio, Mean Adequacy Ratio
1. Introduction
Undernutrition remains one of the leading contributors to childhood morbidity and mortality worldwide. It is estimated to cause 3.1 million deaths among children under five annually, with stunting, wasting, and micronutrient deficiencies being the major underlying factors
| [5] | Bhutta ZA, D. J. (2013). Evidence based interventions for improvement of maternal and child nutrition: what can be done and at what cost?. Lancet, 382: 452–77. |
| [7] | Black RE, V. C. (2013). Maternal and child undernutrition and overweight in low-income and middle-income countries.. Lancet, 382: 427–51. |
[5, 7]
. Approximately 28% of children under five in low- and middle-income countries are stunted
| [6] | Black RE, A. L. (2008). Maternal and child undernutrition: global and regional exposures and health consequences.. Lancet, 371: 243–60. |
[6]
, and the prevalence in sub-Saharan Africa is among the highest at 40%
| [6] | Black RE, A. L. (2008). Maternal and child undernutrition: global and regional exposures and health consequences.. Lancet, 371: 243–60. |
[6]
. The risk is greatest between 6 and 24 months, when poor feeding practices significantly affect growth and development
| [1] | Victora CG, d. O. (2010). Worldwide timing of growth faltering: revisiting implications for interventions.. Pediatrics, 125: e473–80. |
[1]
.
The World Health Organization (WHO) recommends exclusive breastfeeding for the first six months of life and continued breastfeeding up to two years and beyond, complemented by safe and diverse diets
| [22] | WHO. (2003). Global Strategy for Infant and Young Child Feeding Geneva, Switzerland. |
[22]
. Despite these recommendations, many countries in sub-Saharan Africa continue to record low compliance, with a large proportion of infants not receiving the minimum dietary diversity or acceptable meal frequency
| [6] | Black RE, A. L. (2008). Maternal and child undernutrition: global and regional exposures and health consequences.. Lancet, 371: 243–60. |
| [18] | Lutter CK, D. B. (2011). Undernutrition, Poor Feeding Practices, and Low Coverage of Key Nutrition Interventions. Pediatrics, 128. |
[6, 18]
.
In Ethiopia, infant and young child feeding (IYCF) practices remain suboptimal. The national survey data indicate that exclusive breastfeeding, early initiation, and dietary diversity are far below the recommended thresholds. Efforts have been made to improve IYCF practices through national nutrition strategies such as the Sekota Declaration and National Nutrition Program, but the challenges persist
| [12] | FDRE-Ethiopia. (2016). National Nutrition Programm June 2013–June 2015. |
[12]
. For example, in parts of Oromia, studies have found breastfeeding initiation rates of around 70%, exclusive breastfeeding rates near 62%, and complementary feeding practices below optimal levels
| [9] | CSA. (2019). Central Statistical Agency, Ethiopia Demographic and Health Survey, Addis Ababa, Ethiopia. |
[9]
. These findings highlight the urgent need for local-level assessments to inform targeted interventions
| [19] | Mekonnen M, K. T. (2021). Infant and young child feeding practice among mothers of children age 6 to 23 months in Debrelibanos district, North Showa zone, Oromia region, Ethiopia.. PLoS ONE. |
[19]
.
Household dietary diversity is also a critical indicator of nutrition security, reflecting the variety of food groups consumed within a household over a given period. Higher dietary diversity is associated with improved energy and nutrient intake, as well as better socioeconomic status
| [15] | Kennedy G, T. B. (2011). Guidelines for Measuring Household and Individual Dietary Diversity. |
| [20] | Swindale A, P. B. (2006). Household Dietary Diversity Score (HDDS) for Measurement of Household Food Access: Indicator Guide. |
[15, 20]
. However, Ethiopian diets remain heavily cereal-based, with limited intake of animal-source foods, fruits, and vegetables
| [8] | CSA. (2016). CSA and ICF International. Ethiopia Demographic and Health Survey 2016. Addis Ababa, Ethiopia: Central Statistical Agency. |
[8]
. Studies from different parts of Oromia have shown high cereal consumption but low utilization of fruits, vegetables, eggs, and meat, which worsens the risk of nutrient deficiencies
| [3] | Alqeer A, W. G. (2022).. Household Dietary Diversity and Associated Factors among Rural Residents of Gomole District, Borena Zone, Oromia Regional State, Ethiopia. |
| [10] | Dereje D, D. T. (2020). Household dietary diversity in rural households of Oromia Regional state, Ethiopia: A cross-sectional study. |
[3, 10]
.
Therefore, the current study was designed to evaluate child feeding practices and household dietary diversity in Adea, Girar Jarso, and Sebeta Hawas districts of Oromia.
2. Materials and Methods
2.1. Study Area
The study was conducted in three rural districts of Oromia—Sebeta Hawas, Girar Jarso, and Adea—between December 2020 and March 2021. These districts were selected due to their fertile agricultural land and relatively good access to markets and infrastructure. Sebeta Hawas lies about 20 km from Addis Ababa, Adea is 50 km away, and Girar Jarso about 100 km.
2.2. Study Design and Participants
A community-based cross-sectional design was applied. The study targeted caregivers of children aged 6–59 months. Sample size was calculated with a 95% confidence interval, 80% power, and an assumed 15% non-response rate, resulting in 338 households. Complete data were obtained from 332 participants.
2.3. Inclusion and Exclusion Criteria
Caregivers engaged in farming, having children between 6–59 months, and willing to participate were included. Households with sick children or those not residing permanently in the study area were excluded.
2.4. Data Collection
A structured questionnaire was prepared in English and translated into Afan Oromo. It covered caregiver characteristics, exposure to media, land use, and child feeding practices. Data were collected through interviews conducted by trained enumerators. A 24-hour dietary recall method was used to capture children’s and households’ food consumption. Portion sizes were estimated using direct weighing and locally prepared food replicas. Nutrient intake was computed using Ethiopian Food Composition Tables and NutriSurvey software.
2.5. Dietary Diversity Assessment
Children’s dietary diversity score was calculated based on seven WHO food groups, while household dietary diversity was assessed using twelve food groups. Nutrient adequacy was determined using the Nutrient Adequacy Ratio (NAR) and Mean Adequacy Ratio (MAR). Intakes were considered inadequate if NAR < 66%, fairly adequate if 66–99%, and adequate if ≥100%.
2.6. Data Analysis
SPSS v25 was used for statistical analysis. Results are presented as frequencies and percentages for categorical variables, and as means ± standard deviation for continuous variables.
2.7. Ethical Considerations
The study was approved by the Institutional Review Board of Addis Ababa University and the Oromia Health Bureau. Informed consent was obtained from all participants, and confidentiality of responses was maintained.
3. Results
3.1. Children Feeding Practices
Forty-one percent of the children did not feed breast milk within one hour of birth (
Table 1). However, exclusive breastfed during the first six months of age is 63%. On time introduction of complementary foods was below 50% (39.2%). On the other hand, continuous breastfeeding was 65%. Literature show that child-feeding practices
had a direct
link
with childhood diarrhea.
More than a quarter (28%) of the children were suffering from diarrhea during the past two weeks. Household owning of toilet facility can also be linked to sanitation and hygiene of children and feeding practice of children in turn. In the current study seventy-six percent of the households, own toilet facility.
Table 1. Under five Children feeding practices and diarrhea related in Sebeta Hawas, Adea, and Girar Jarso woredas of Oromia.
Feeding practices | All n (Percent) 332 |
Breastfeeding within one hour of birth | Yes | 196 (59) |
No | 136 (41) |
Exclusive breastfeeding for six months | Yes | 208 (62.7) |
No | 124 (37.3) |
Timely introduction of complementary foods | Yes | 130 (39.2) |
No | 202 (60.8) |
Continuous breastfeeding up to 2 years | Yes | 214 (64.5) |
No | 118 (35.5) |
Diarrhea during the past 2 weeks | Yes | 93 (28) |
No | 239 (72) |
Own toilet facility | Yes | 252 (75.9) |
No | 80 (24.1) |
3.2. Child Dietary Diversity
Table 2. Food groups consumed during the 24 hour recall period and dietary diversity score of under five children in Adea, Sebeta Hawas and Girar Jarso woredas of Oromia.
Dietary diversity | Frequency (Percent) |
Minimum dietary diversity* | |
Consumed ≥4 food groups | 142 (42.7) |
Consumed <4 food groups | 190 (57.3) |
The scale of dietary diversity score | |
Low (0-2 food groups) | 124 (37) |
Medium (3-4 food groups) | 111 (33) |
High (>4 food groups) | 97 (29) |
On the other side, concerning dietary diversity only 43% of the children consumed from more than or equal to four food groups, while majority of the children (57%) consumed from less than four food groups. Depending on the scale of dietary diversity score, greater percentage of the children (37%) were categorized under low dietary diversity score, which was consumption of zero to two food groups. Depending on the category, children who consumed medium and high food groups were 33% and 29% respectively.
3.2.1. Nutrients Adequacy Ratio and Mean Adequacy Ratio of Children Aged 6 to 59 Months in Sebeta Hawas, Adea and Girar Jarso, Oromia
The mean adequacy ratio (MAR) was calculated to be 79.2% for female and 84.6% for male children. Calcium and ascorbic acid NAR were 60 and 43 respectively for female children as the NAR ranges less than 66%. Therefore, female children are inadequate of these two nutrients. However, protein, carbohydrate, phosphorus, thiamine and Riboflavin NAR of the female children included in the study ranges between 66% and 100% and these children are classified as fairly adequate of the listed nutrients. The NAR of iron and energy are above 100, and the female children in the present study area were adequate of iron and energy.
Similar to under-five female children included in the present study areas, NAR of fat and ascorbic acid were found to be less than 66, and accordingly the male under five children in Girar Jarso, Adea and Sebeta Hawas of Oromia are inadequate of fat and ascorbic acid. However, protein, carbohydrate, calcium thiamine and riboflavin were the nutrients whose NAR ranges between 66 to 100% and these nutrients were classified as fairly adequate nutrients. Similarly, under-five male children were found to be adequate of energy, phosphorus and Iron as the range of NAR are more than 100% as shown in the
table 3 below.
Table 3. Nutrients Adequacy Ratio and Mean Adequacy Ratio (MAR) for both male and female children aged 6 to 59 months in sebeta Hawas, Adea and Girar Jarso, Oromia.
Types of nutrients | Female | Male |
6-12 months | b/n 13 and 36 mon | b/n 37 and 60 mon | NAR | 6-12 mon | b/n 13 and 36 months | b/n 37 and 60 mon | NAR average |
Energy | 132 | 101 | 120 | 117 | 113 | 109 | 97 | 106 |
Protein | 59 | 78 | 67 | 68 | 83 | 89 | 104 | 92 |
Fat | 60 | 80 | 40 | 60 | 30 | 50 | 40 | 40 |
Carbohydrate | 70 | 98 | 130 | 99 | 110 | 100 | 81 | 97 |
Calcium | 65 | 54 | 61 | 60 | 110 | 60 | 60 | 76 |
Phosphorus | 112 | 101 | 72 | 95 | 16 | 150 | 150 | 105 |
Iron | 89 | 122 | 93 | 101 | 70 | 110 | 120 | 100 |
Thiamine | 62 | 80 | 91 | 77 | 90 | 90 | 90 | 90 |
Riboflavin | 71 | 84 | 53 | 69 | 86 | 67 | 74 | 76 |
Ascorbic acid | 80 | 30 | 20 | 43 | 80 | 18 | 90 | 62.7 |
MAR | 80 | 82.9 | 74.7 | | 78.8 | 84.5 | 90.6 | |
NAR- Nutrients Adequacy Ratio
MAR- Mean Adequacy Ratio
3.2.2. Household’s Dietary Diversity (HDDS) in Sebeta Hawas, Adea, and Girar Jarso Woredas of Oromia
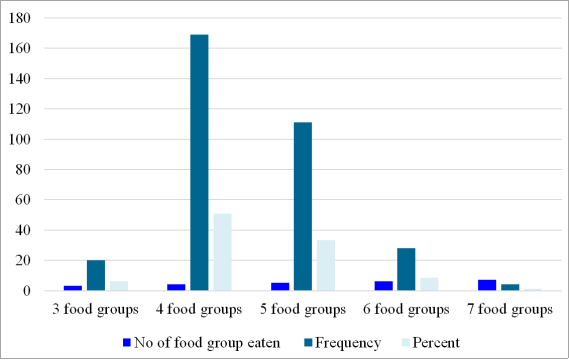
Dietary diversity is a qualitative measure of food consumption that reflects household access to a variety of foods. The dietary diversity consists of a simple count of food groups that a household or an individual has consumed over the preceding 24 hours (FAO, 2011). In the current study, household dietary diversity was analyzed following FAO guideline, which is the sum of the different food groups consumed, and 12 food groups are used in the analysis. The result of current study indicated that 51% of the households included in the study are consuming from four different food groups whereas small (6%) of the respondents included in the study are consuming from only three food groups. It is also found that 33.4% of the households consumes from five food groups and 8.4% of the respondents from 6 food groups and only 1.2% of the households are consuming from seven food groups. Even though there is no cut off point for the adequacy food groups consumed, only 10% of all the households consume more than half (greater than 6) of all the food groups.
Figure 1. Number, frequency and percent of food group consumed in Sebeta Hawas, Adea, and Girar Jarso woredas of Oromia.
Table 4. Frequency and percentage of food groups consumed in Sebeta Hawas, Adea, and Girar Jarso woredas of Oromia.
Food groups | N (%) |
Cereals | 316 (95) |
Tubers And Roots | 42 (12.7) |
Vegetables | 263 (79.2) |
Fruits | 83 (25) |
Meat | 42 (12.7) |
Eggs | 19 (5.7) |
Fish And Other Seafood | 67 (20.2) |
Legumes, Nuts And Seeds | 259 (78) |
Milk And Milk Products | 103 (31) |
Oils And Fats | 286 (86.1) |
Sweats | 43 (13) |
Spices | 306 (92) |
In the study areas that are currently included, cereals are widely produced and consumed. It is found that more than 90%households consume cereals. Tubers and roots are consumed only by 13% of the respondent’s households. Only 25% of the respondents consume foods categorized under fruit food groups, which are excellent source of essential vitamins, minerals and antioxidants including flavonoids.
Foods of animal source in general are not highly consumed developing countries because of relatively their price
| [2] | Admasu T., Beneberu A,. (2019). Determinants of household dietary diversity in the Yayo biosphere reserve of Ethiopia: An empirical analysis using sustainable livelihood framework. Cogent Food & Agriculture, 1690829. |
[2]
. Only 12.7% of the respondents in the current study area consume meat and egg is the less consumed than meat; only 5.7% of the households included in the study area reported that they are consuming eggs. Legumes and nuts are a group of food widely consumed by 78.2% of the sampled households. Group of food that is categorized as milk, cheese, yoghurt is also under consumed. 31% of the households are consuming foods that are grouped as dairy product. Oils and fats are widely consumed group of food by 86% of the households. Sweats are foods like cookies, biscuits, honey, candy, cakes. In the current finding study areas 25% of the households consume from fruit food group.
4. Discussion
Improper breastfeeding and complementary feeding practices were common. High proportion of children were not breastfed within one hour of birth and were not exclusively breastfed (~ 40%). This is unlucky considering the losses from various dimensions such as health, economic, social and environment
| [21] | Victora CG, B. R. (2016). Breastfeeding in the 21st century: epidemiology, mechanisms, and lifelong effect. Lancet, 387(10017): 475–90. |
[21]
. Not only the children but the mothers will also miss the opportunity to be protected from breast and ovarian cancer
| [4] | Bartick MC, S. E. (2017). Suboptimal breastfeeding in the United States: maternal and pediatric health outcomes and costs. Matern Child Nutr, 13(1): e12366. |
| [21] | Victora CG, B. R. (2016). Breastfeeding in the 21st century: epidemiology, mechanisms, and lifelong effect. Lancet, 387(10017): 475–90. |
[4, 21]
. In addition, the improper breastfeeding will increase greenhouse gases, a carbon footprint and waste of the environment through formula feeding
. The prevalence of breastfeeding within one hour of birth (59%) and the prevalence of continuous breastfeeding at 2 years (64.5) were distant from the national proportion of 72% for both feeding practices
| [19] | Mekonnen M, K. T. (2021). Infant and young child feeding practice among mothers of children age 6 to 23 months in Debrelibanos district, North Showa zone, Oromia region, Ethiopia.. PLoS ONE. |
[19]
. However, exclusive breastfeeding for six months was 63%, which was slightly higher than the national prevalence of 59% from the 2019 Ethiopian National Health survey
| [19] | Mekonnen M, K. T. (2021). Infant and young child feeding practice among mothers of children age 6 to 23 months in Debrelibanos district, North Showa zone, Oromia region, Ethiopia.. PLoS ONE. |
[19]
. The reason for the observed differences in proportion could be differences in the study design. This study is a cross sectional study and only one data point is collected.
The current rate of exclusive breastfeeding in the study area met the WHO global nutrition targets percentage of at least 50% by the year 2025. This is encouraging considering that breastfeeding support lifelong health for the mother and the child
| [17] | Louis-Jacques AF, S. A. (2020). Enabling breastfeeding to support lifelong health for mother and child.. Obstet Gynecol Clin North Am, 47(3): 363–81. |
[17]
. However, the collective targets for these global rates in 2030 are 70% for initiation in the first hour, 70% for exclusive breastfeeding, 80% at one year, and 60% at two years
| [19] | Mekonnen M, K. T. (2021). Infant and young child feeding practice among mothers of children age 6 to 23 months in Debrelibanos district, North Showa zone, Oromia region, Ethiopia.. PLoS ONE. |
[19]
. Based on this, the rate of breastfeeding within one hour of birth; exclusive breastfeeding; and continuous breastfeeding at two years in the study area were only 84%, 89.6% and 80.6% of the global target set to be met in 2030. Therefore, the country’s efforts towards meeting the target rates of breastfeeding must be amplified. Exclusive breastfeeding for six months was only 63% this may be because of the high ownership of domestic animals/cattle among the households that is associated with early introduction of milk
| [18] | Lutter CK, D. B. (2011). Undernutrition, Poor Feeding Practices, and Low Coverage of Key Nutrition Interventions. Pediatrics, 128. |
[18]
.
The proportion of timely introduction of complementary foods was better in this study compared to the reported 98% of children who were complemented before the age of 6 months in Kenya
| [16] | Kimani-murage EW, M. s. (2011). Patterns and determinants of breastfeeding and complementary feeding practices in urban informal settlements, Nairobi Kenya. BMC Public Health, 11(396). |
[16]
. Part of the reason for the proportion difference could be variation in the mothers’ perception about child feeding or it might be related to the effectiveness of the nutrition education delivered to the mothers. In addition, the timely introduction of complementary foods was less than 40% in this study, which is problematic given that early introduction of complementary feeding is associated with a substantially increased risk of frequent diarrhea and other infectious diseases resulting in undernutrition
| [20] | Swindale A, P. B. (2006). Household Dietary Diversity Score (HDDS) for Measurement of Household Food Access: Indicator Guide. |
[20]
. This will explain diarrhea reported by 1/3 of the children in this study that could be linked to inadequate access to clean and safe water in in the country leading to microbial contamination of complementary foods through unsafe preparation and storage.
More than 90% of households consume cereals in the present study, which is in line with Dereje (2020), Admasu and Beneberu (2019). The reason of high consumption of cereals could be attributed to high production capacity and less awareness of dietary diversity among the society. However, tubers and roots are consumed only by 13% of households, which is different from Dereje (2020). Only 25% of the respondents consume foods categorized under fruit food groups, which are excellent source of essential vitamins, minerals and antioxidants including flavonoids. Although, the production of fruits are easy at household, by using for example home gardening using small area of land, due to lack of awareness there is little consumption.
Food of animal sources are good for supplying nutrients that are essential to life and needed for healthy growth, development, and functioning. However, they are not highly consumed developing countries because of relatively their price. Only about 19% of the households in the current study area consume meat and eggs. Legumes and nuts are also consumed highly by 78.2% of the sampled households, which is similar to Dereje (2020). Cattle production is one of the main agricultural industries in Ethiopia and currently
| [13] | Gebrekidan, B. D. (n.d.). The state of agricultural science and technology in Ethiopia. Ethiopian Academy of Sciences. pp. 297-320. |
[13]
, the country produces over 3.8 billion liters of milk (FAO and NZAGRC, 2017). Per capita consumption is approximately 19 kg of milk
| [11] | Dessie, T. a. (2013). Ethiopian livestock: resource base, strategies for improvement and use. |
[11]
. However, dairy products are consumed only by 31% of the households are consuming foods that are grouped as dairy product.
Concerning scale of dietary diversity, 37% of the households fall within low dietary diversity category, which is more than study conducted by Admasu and Beneberu (2019).
5. Conclusion and Recommendations
5.1. Conclusions
The infant and young child feeding practices were sub-optimal. Even though majority of the households own toilet facility the prevalence of diarrhea was substantial among the children. Starchy staples, legume and nuts were consumed widely among the children. But consumption of animal source foods was very low except dairy products. Majority of the under-five children consume less than four food groups, which is less than half of the total food group. In addition, about 33% of the children consumption of food groups fall under low and 37% under medium. The calculated Nutrients adequacy ratio (NAR) of Calcium, fat and ascorbic acid showed that the intake were inadequate. However, the calculated NAR showed that intake of protein, carbohydrate, phosphorus, thiamine and Riboflavin were fairly adequate. However, energy and Iron intake in take were adequate. Highest percentage of the households (51%) consume from four different food groups whereas only 10% of all the households consume more than half (greater than 6) of all the food groups.
5.2. Recommendations
1) Strengthening breastfeeding promotion and timely complementary feeding through community health programs.
2) Expanding nutrition education focusing on the benefits of diversified diets.
3) Promoting poultry, apiculture, intercropping, and small-scale irrigation for fruits and vegetables.
4) Supporting policies that enhance year-round access to affordable, diverse foods.
These interventions are essential for improving dietary adequacy and achieving national and global nutrition targets.
Abbreviations
WHO | World Health Organization |
NAR | Nutrient Adequacy Ratio |
IYCF | Infant and Young Child Feeding |
MAR | Mean Adequacy Ratio |
Author Contributions
Geleta Dereje: Conceptualization, Data curation, Formal Analysis, Funding acquisition, Investigation, Methodology, Resources, Software, Validation, Visualization, Writing – original draft, Writing – review & editing
Aynadis Tamene: Conceptualization, Investigation, Project administration, Resources, Supervision, Validation, Writing – original draft
Zeweter Abebe: Conceptualization, Data curation, Formal Analysis, Investigation, Methodology, Project administration, Software, Supervision, Validation, Visualization, Writing – original draft, Writing – review & editing
Conflicts of Interest
The authors declare no conflicts of interest.
References
| [1] |
Victora CG, d. O. (2010). Worldwide timing of growth faltering: revisiting implications for interventions.. Pediatrics, 125: e473–80.
|
| [2] |
Admasu T., Beneberu A,. (2019). Determinants of household dietary diversity in the Yayo biosphere reserve of Ethiopia: An empirical analysis using sustainable livelihood framework. Cogent Food & Agriculture, 1690829.
|
| [3] |
Alqeer A, W. G. (2022).. Household Dietary Diversity and Associated Factors among Rural Residents of Gomole District, Borena Zone, Oromia Regional State, Ethiopia.
|
| [4] |
Bartick MC, S. E. (2017). Suboptimal breastfeeding in the United States: maternal and pediatric health outcomes and costs. Matern Child Nutr, 13(1): e12366.
|
| [5] |
Bhutta ZA, D. J. (2013). Evidence based interventions for improvement of maternal and child nutrition: what can be done and at what cost?. Lancet, 382: 452–77.
|
| [6] |
Black RE, A. L. (2008). Maternal and child undernutrition: global and regional exposures and health consequences.. Lancet, 371: 243–60.
|
| [7] |
Black RE, V. C. (2013). Maternal and child undernutrition and overweight in low-income and middle-income countries.. Lancet, 382: 427–51.
|
| [8] |
CSA. (2016). CSA and ICF International. Ethiopia Demographic and Health Survey 2016. Addis Ababa, Ethiopia: Central Statistical Agency.
|
| [9] |
CSA. (2019). Central Statistical Agency, Ethiopia Demographic and Health Survey, Addis Ababa, Ethiopia.
|
| [10] |
Dereje D, D. T. (2020). Household dietary diversity in rural households of Oromia Regional state, Ethiopia: A cross-sectional study.
|
| [11] |
Dessie, T. a. (2013). Ethiopian livestock: resource base, strategies for improvement and use.
|
| [12] |
FDRE-Ethiopia. (2016). National Nutrition Programm June 2013–June 2015.
|
| [13] |
Gebrekidan, B. D. (n.d.). The state of agricultural science and technology in Ethiopia. Ethiopian Academy of Sciences. pp. 297-320.
|
| [14] |
Karlsson JO, Garnett T, Rollins NC, Röös E. The carbon footprint of breastmilk substitutes in comparison with breastfeeding. J Clean Prod. 2019; 222: 436–45.
https://doi.org/10.1016/j.jclepro.2019.03.043
|
| [15] |
Kennedy G, T. B. (2011). Guidelines for Measuring Household and Individual Dietary Diversity.
|
| [16] |
Kimani-murage EW, M. s. (2011). Patterns and determinants of breastfeeding and complementary feeding practices in urban informal settlements, Nairobi Kenya. BMC Public Health, 11(396).
|
| [17] |
Louis-Jacques AF, S. A. (2020). Enabling breastfeeding to support lifelong health for mother and child.. Obstet Gynecol Clin North Am, 47(3): 363–81.
|
| [18] |
Lutter CK, D. B. (2011). Undernutrition, Poor Feeding Practices, and Low Coverage of Key Nutrition Interventions. Pediatrics, 128.
|
| [19] |
Mekonnen M, K. T. (2021). Infant and young child feeding practice among mothers of children age 6 to 23 months in Debrelibanos district, North Showa zone, Oromia region, Ethiopia.. PLoS ONE.
|
| [20] |
Swindale A, P. B. (2006). Household Dietary Diversity Score (HDDS) for Measurement of Household Food Access: Indicator Guide.
|
| [21] |
Victora CG, B. R. (2016). Breastfeeding in the 21st century: epidemiology, mechanisms, and lifelong effect. Lancet, 387(10017): 475–90.
|
| [22] |
WHO. (2003). Global Strategy for Infant and Young Child Feeding Geneva, Switzerland.
|
Cite This Article
-
APA Style
Dereje, G., Tamene, A., Abebe, Z. (2025). Children Feeding Practices and Household Dietary Diversity in Adea, Girar Jarso, and Sebeta Hawas Districts, Oromia, Ethiopia. Journal of Food and Nutrition Sciences, 13(5), 264-270. https://doi.org/10.11648/j.jfns.20251305.15
 Copy
|
Copy
|
 Download
ACS Style
Dereje, G.; Tamene, A.; Abebe, Z. Children Feeding Practices and Household Dietary Diversity in Adea, Girar Jarso, and Sebeta Hawas Districts, Oromia, Ethiopia. J. Food Nutr. Sci. 2025, 13(5), 264-270. doi: 10.11648/j.jfns.20251305.15
Copy
|
Download
AMA Style
Dereje G, Tamene A, Abebe Z. Children Feeding Practices and Household Dietary Diversity in Adea, Girar Jarso, and Sebeta Hawas Districts, Oromia, Ethiopia. J Food Nutr Sci. 2025;13(5):264-270. doi: 10.11648/j.jfns.20251305.15
Copy
|
Download
-
@article{10.11648/j.jfns.20251305.15,
  author = {Geleta Dereje and Aynadis Tamene and Zeweter Abebe},
  title = {Children Feeding Practices and Household Dietary Diversity in Adea, Girar Jarso, and Sebeta Hawas Districts, Oromia, Ethiopia
},
  journal = {Journal of Food and Nutrition Sciences},
  volume = {13},
  number = {5},
  pages = {264-270},
  doi = {10.11648/j.jfns.20251305.15},
  url = {https://doi.org/10.11648/j.jfns.20251305.15},
  eprint = {https://article.sciencepublishinggroup.com/pdf/10.11648.j.jfns.20251305.15},
  abstract = {Background: Malnutrition among children in Ethiopia remains a serious public health concern, with feeding practices frequently falling below international standards. Diets are often cereal-based with low inclusion of animal-source foods, resulting in poor dietary diversity. This study assessed child feeding practices and household dietary diversity in three districts of Oromia. Methods: A community-based cross-sectional survey was conducted among 332 caregivers of children aged 6–59 months. Data were collected using a structured questionnaire and a 24-hour dietary recall. Nutrient intake was analyzed using the Ethiopian Food Composition Tables and SPSS v25. Dietary diversity was evaluated using WHO and FAO criteria, and nutrient adequacy was determined using Nutrient Adequacy Ratio (NAR) and Mean Adequacy Ratio (MAR). Results: Early initiation of breastfeeding was 59%, while exclusive breastfeeding at six months was 63%. Timely introduction of complementary feeding was only 39%, and continued breastfeeding at two years was 64.5%. Just 43% of children consumed at least four food groups, with 37% falling into the low dietary diversity category. The MAR was 82%, with inadequate intakes of calcium, fat, and vitamin C, while protein, carbohydrate, iron, and energy were sufficient. At the household level, 51% consumed from four food groups, but only 10% consumed more than six. Cereals dominated diets (>90%), while meat (12.7%), eggs (5.7%), and fruits (25%) were seldom consumed. Conclusion: Suboptimal infant and young child feeding practices and low dietary diversity persist in the study areas. Strategies are needed to strengthen optimal breastfeeding, promote nutrition education, and diversify diets through improved livestock production, horticulture, and small-scale irrigation.
},
 year = {2025}
}
Copy
|
Download
-
TY  - JOUR
T1  - Children Feeding Practices and Household Dietary Diversity in Adea, Girar Jarso, and Sebeta Hawas Districts, Oromia, Ethiopia

AU  - Geleta Dereje
AU  - Aynadis Tamene
AU  - Zeweter Abebe
Y1  - 2025/10/09
PY  - 2025
N1  - https://doi.org/10.11648/j.jfns.20251305.15
DO  - 10.11648/j.jfns.20251305.15
T2  - Journal of Food and Nutrition Sciences
JF  - Journal of Food and Nutrition Sciences
JO  - Journal of Food and Nutrition Sciences
SP  - 264
EP  - 270
PB  - Science Publishing Group
SN  - 2330-7293
UR  - https://doi.org/10.11648/j.jfns.20251305.15
AB  - Background: Malnutrition among children in Ethiopia remains a serious public health concern, with feeding practices frequently falling below international standards. Diets are often cereal-based with low inclusion of animal-source foods, resulting in poor dietary diversity. This study assessed child feeding practices and household dietary diversity in three districts of Oromia. Methods: A community-based cross-sectional survey was conducted among 332 caregivers of children aged 6–59 months. Data were collected using a structured questionnaire and a 24-hour dietary recall. Nutrient intake was analyzed using the Ethiopian Food Composition Tables and SPSS v25. Dietary diversity was evaluated using WHO and FAO criteria, and nutrient adequacy was determined using Nutrient Adequacy Ratio (NAR) and Mean Adequacy Ratio (MAR). Results: Early initiation of breastfeeding was 59%, while exclusive breastfeeding at six months was 63%. Timely introduction of complementary feeding was only 39%, and continued breastfeeding at two years was 64.5%. Just 43% of children consumed at least four food groups, with 37% falling into the low dietary diversity category. The MAR was 82%, with inadequate intakes of calcium, fat, and vitamin C, while protein, carbohydrate, iron, and energy were sufficient. At the household level, 51% consumed from four food groups, but only 10% consumed more than six. Cereals dominated diets (>90%), while meat (12.7%), eggs (5.7%), and fruits (25%) were seldom consumed. Conclusion: Suboptimal infant and young child feeding practices and low dietary diversity persist in the study areas. Strategies are needed to strengthen optimal breastfeeding, promote nutrition education, and diversify diets through improved livestock production, horticulture, and small-scale irrigation.

VL  - 13
IS  - 5
ER  -
Copy
|
Download